Blogs
- Home
- »
- Blogs
Visualizing on-time delivery performance
30 July 2024
On-time delivery (OTD) is a critical Key Performance Indicator (KPI) for assessing supplier performance. Due to its importance, it is critical to share and collaborate the data with suppliers. It's not enough to share the raw data, it is essential to visualize the data as well.
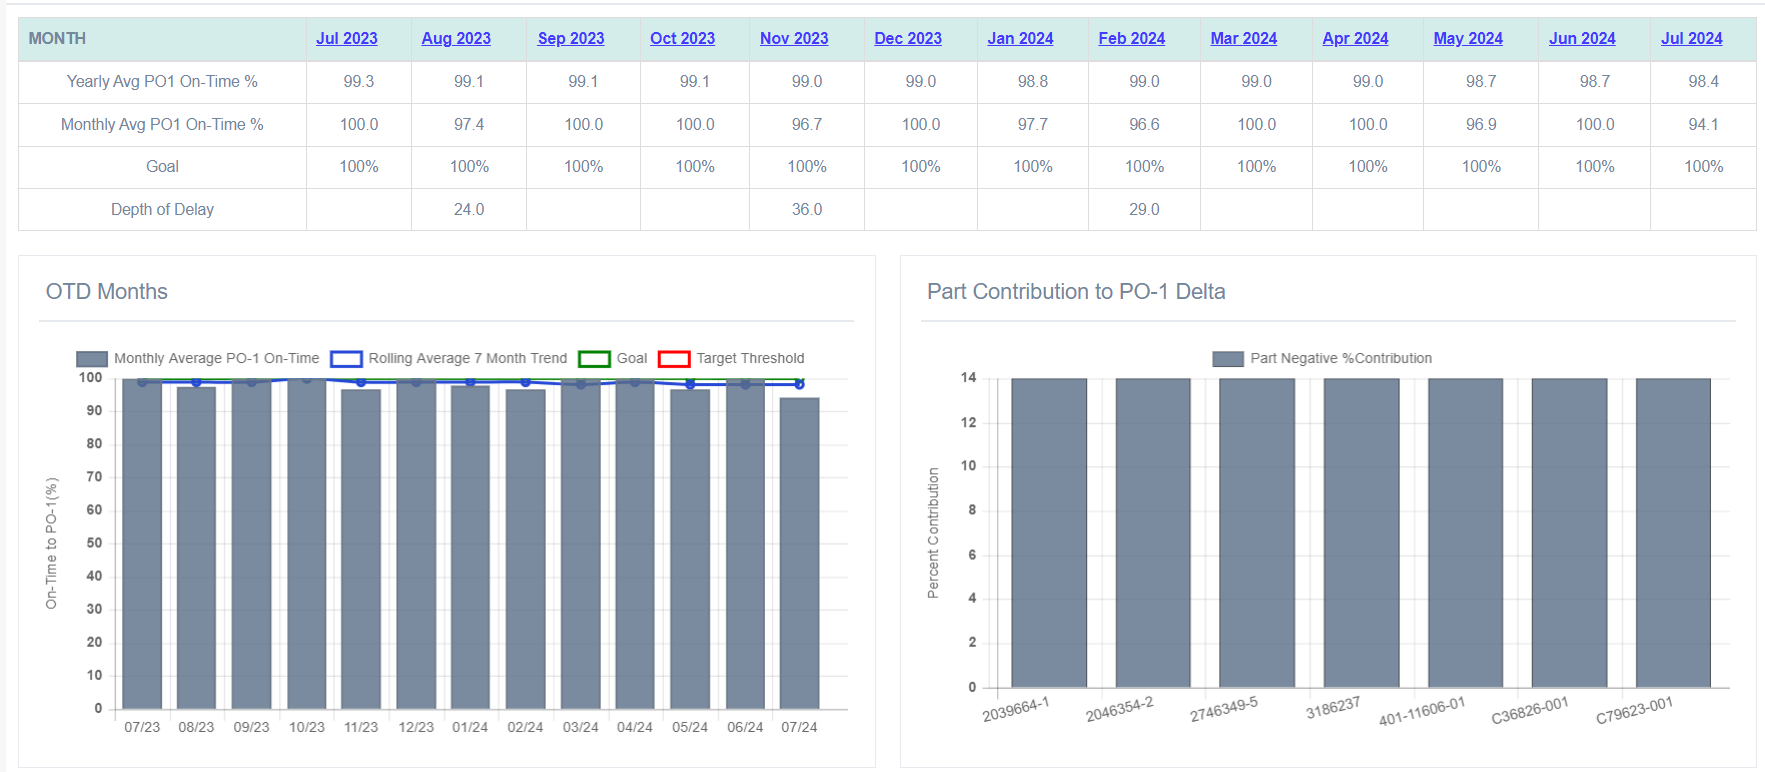
Unlock excellence with supplier scorecards: Transparency fuels trust and efficiency and Optimizes performance!
Visualizing is crucial for several reasons:
1. Identifying Performance Trends: Visualizations can highlight trends over time, showing whether supplier performance is improving, declining, or remaining stable.
2. Simplifying Data Interpretation: Charts and graphs make complex data easier to understand.
3. Enhancing Decision-Making: With clear visual data, decision-makers can make informed choices quickly. For instance, they can easily spot underperforming suppliers and take corrective actions or negotiate better terms.
4. Improving Communication: Visuals are more engaging and can be used to effectively communicate performance metrics to different stakeholders, including management, procurement teams, and suppliers themselves. This can foster better collaboration and understanding.
5. Quickly Spotting Issues: Visual reports can highlight exceptions or anomalies, such as sudden drops in on-time deliveries. Early detection of such issues can lead to quicker problem resolution.
6. Supporting Continuous Improvement: Regular visualization of performance metrics encourages a culture of continuous improvement.
7. Enhancing Accountability: Visual data can make performance metrics transparent, enhancing accountability among suppliers.